Sales forecasting
and inventory optimization
Become a retail mastermind you always wanted to be.
Become a retail mastermind you always wanted to be.
By: Jul Domingo
First-time entrepreneurs often rely on spreadsheets, which isn’t surprising at all. It’s multi-functional, capable of basic computations, data entry, sorting, analysis, accounting, and even—inventory forecasting.
The goal of inventory forecasting is to forecast stock values based on intrinsic factors to keep businesses profitable and customers happy—but it’s not one size fits all.
Excel has a feature for forecasting inventory levels. But when businesses scale, is it enough?
In this blog post, we’ll talk about inventory forecasting in Excel, its pros and cons, how-to’s, and basic functions.
Yes, it’s possible. Microsoft Excel has already gone through several updates since 1987, and its latest features offer predesigned forecasting designs and functions for business use.
However, it has its own share of flaws. Excel’s analysis is limited to its functions and formulas. In a fast-paced age of trends and data, it doesn’t offer the ability to provide the accuracy and functionality more modern tools offer. Read on to discover the pros and cons of using spreadsheets for your inventory forecasting needs.
Here are a few reasons why inventory forecasting in Excel is a good starting point for SMEs:
Microsoft offers different business plan subscriptions starting at $2.50/mo per user. It comes with Excel features that help new business owners manage sales reports without spending much. Cloud sync allows your team to work together on the forecast in a single Excel file, while snapping a picture of printed tables automatically converts them into editable Excel spreadsheets.
Excel’s conditional formatting selection saves historical data for each subsequent forecast. You can also customize the appearance of cells with data bars, color scales, and icon sets and format the cells of all the months that exceed the sales quota with blue fill in a few clicks.
These help identify trend patterns and emphasize important values for your forecast and highlight important sales trends when estimating future inventory levels, while preventing information overload from too much data.
Visual presentation increases responsiveness and decisiveness by 64% and boosts productivity by reducing meeting hours by 24%. Inventory forecasting in Excel communicates data well to end-users, giving them the whole picture, not just the numbers themselves. Excel’s chart function creates graphs and charts to give a comparable overview of historical, actual, and forecasted data, so users can follow the movement of sales forecast and ideal inventory level.
Excel can fill up the predicted values based on given the past and existing values, but Excel formulas and functions are what make it work. They are pre-determined for more complex use.
Formulas calculate the values in a range of cells while functions calculate any mathematical, logical, financial, and statistical operations.Under the “statistical” category, Excel has six different forecast functions:
59% of companies with less than $25M in revenue reported that they use Excel in accounting. If you do, then all historical data from your past sales and purchases are already in Excel, enabling you to refer to them when forecasting.
If you use other software, such as Quickbooks and SAP for recording transactions, integration is also an option. This feature will let you export records which you can use directly in creating your forecast.
Excel is becoming obsolete with the advent of technology. Here are some reasons you should skip ahead to a more cutting-edge inventory forecasting tool that can avoid the following:
Let’s look at this scenario: A staff member mistakenly typed 109 units for the total sales quantity in November, when it should have been 190. What’s likely to happen? This oversight will probably lead to understocking.
Excel requires updated and accurate records to ensure the reliability of the forecast, but only the process of generating inventory forecasting is automated. This leaves a lot of room for error, especially since even the most experienced data entry operators are prone to mistakes.
Add to that, once you scale your business, increasing your SKUs and dealing with voluminous transactions, you’re more likely to make clerical/typographical errors. Excel forecasts can be misinterpreted if you lack the necessary expertise.
With Microsoft Excel, dealing with tedious data input and decentralized recording is a given. It can be daunting for omnichannel businesses to collect data from different sources and organize, monitor, and update them in a single Excel spreadsheet every single time.
Furthermore, forecasting only allows you to prioritize one SKU at a time. So if you have 1, 000 products on your roster, you need to create 1,000 Excel sheets. Unless, you forecast everything all together to speed things up, which completely sacrifices accuracy.
Not to mention, locating, exporting, and analyzing data for your Excel forecast eats a lot of time compared to using smart inventory forecasting software. As a budding entrepreneur, Excel isn’t the best choice for you if you can’t afford to lose time on more important tasks.
Forecasts contain confidential business information about the company, such as revenue, expenses, profits, and losses—and in some cases, marketing and operation plans. But Excel can’t provide extensive security protection to keep this information private.
Once you send out your inventory forecasting in Excel sheet via email, you’ll no longer have control over who can access it, running the risk of getting it to the wrong person and having them forward it to your competitors.
Excel only provides pre-designed forecast results based on the data you input, but it doesn’t guarantee everyone will understand. It still requires customization and presentation to be completely comprehensible.
Inventory forecasting methods can be intimidating as well. Ideally, the person doing the forecast should be a pro at Excel to minimize costly errors. If not, it will only reduce the effectiveness and efficiency of inventory forecasting.
Manual processes are riskier compared to automation. Based on research, 62% of companies reported that the latter could potentially solve major inefficiencies.
Unfortunately, inventory forecasting in Excel breeds data omission. For one, getting feedback from decision-makers after the distribution of forecasts leads to omission. Revisions and modifications can be difficult when finalizing the forecast plan using Microsoft Excel.
Excel only uses historical data and past trends. It needs current information before it can give you forecasts for decision making. Due to a slow manual data input process, today’s data becomes historical first before forecast results are available.
No features are available to track and adapt to real-time changes. With this limitation, forecasts are more likely to be outdated and less accurate.
Excel’s latest cloud-sync collaboration feature isn’t enough to cover all the bases. Most users don’t approve of live team editing because it can’t track the changes made properly. The only way to get over this problem is to go back to manual record consolidation.
Think of the time involved in manually saving, sharing, merging, and exporting data all the time. At the end of the day, Excel should help streamline work, not become the work itself.
If you’ve been using Excel for a while, the limit of columns and rows is not the problem—the working performance is. You have your worksheets filled with forecast functions, Excel templates, and Pivot tables—but when you think you’re becoming more efficient, everything starts lagging.
It’s inevitable for businesses to accumulate data as they grow. Forecasting is an ongoing process, not just a one-time thing, so you need to find the right solution that scales with your business needs.
A simple inventory forecast in Excel serves your needs if you’re a new business owner or are still within the first two years of operations. The following sections are particularly helpful:
Inventory forecasting in Excel doesn’t fit all situations due to different variables to consider, but it has basic functions that can help improve the level of accuracy needed, such as:
Syntax:
FORECAST(x, known_y’s, known_x’s)
This forecast function predicts future values using linear regression. To calculate the trend, the future value is a y-value for a given x-value.
Inventoro’s Pro Tip: Sales are never linear, so we don’t advise relying on this forecast function.
Syntax:
FORECAST.ETS(target_date, values, timeline, [seasonality], [data_completion], [aggregation])
This forecast function follows time series forecasting functions to predict future trends based on historical data and uses the AAA version of the Exponential Smoothing (ETS) algorithm.
Syntax:
FORECAST.ETS.CONFINT(target_date, values, timeline, [confidence_level], [seasonality], [data_completion], [aggregation])
This forecast function is used in conjunction with FORECAST.ETS to show the confidence interval of the predicted value. To understand better: a 100% confidence level indicates that if you repeat today’s sales forecast next month, the results will be the same.
Syntax:
FORECAST.ETS.SEASONALITY(values, timeline, [data_completion], [aggregation])
This forecasts value based on existing and historical data that follow a seasonal trend. It also analyzes the highest peak and lowest point of sales given the data series of a specific timeline. You can use it as a standalone function or together with FORECAST.ETS.
Syntax:
FORECAST.ETS.STAT( values, timeline, statistic_type, [seasonality], [data completion], [aggregation] )
This presents the specific statistical value of time series forecasting results and the optional statistics included are alpha, beta, and gamma parameters. This function follows more advanced algorithms like the Exponential Triple Smoothing (ETS).
Syntax:
FORECAST function: FORECAST(x, known_y’s, known_x’s)
FORECAST.LINEAR function: FORECAST.LINEAR(x, known_y’s, known_x’s)
This sales forecasting function works exactly like the FORECAST function. It replaced ´FORECAST´ in 2016 so it’s the function available for the latest Excel versions.
After you click the Create button, Excel automatically opens a new worksheet with the historical, predicted values, and a visual representation.
You can further customize your forecast to improve accuracy. The following forecast options are available:
Forecast Start. Select the starting date of your forecast. Pro tip: Start the sales forecast while currently gathering sales records. If you’re predicting next quarter’s sales, start today to improve accuracy.
Confidence Interval. Hide or unhide the Confidence Interval by ticking the box. This option will help you gauge the accuracy of your forecast.
Seasonality. This option detects the data points of the seasonal pattern. In an annual cycle presenting each month, your seasonality will automatically be 12, but you can also manually set the seasonality.
Timeline Range and Values Range. This feature changes the range of your timeline. Note: The Timeline range needs to match the Values Range.
Fill Missing Points Using. If there are missing data between your records, Excel will fill the missing point by calculating the weighted average of the nearest points available. Click Zero if you want to treat the missing points as nil.
Aggregate Duplicates Using. For multiple values in the same timestamp, Excel will compute the average value as a preset. To change computation, you can select from other methods in the list.
Include Forecast Statistics. Simply tick the box if you want to include more statistical information. It will generate a table using the FORECAST.ETS.STAT function.
Methods for quantitative forecasting include the following:
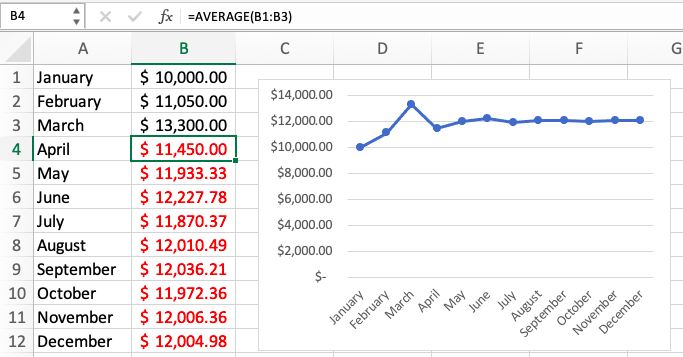
The purpose of the moving average is to smooth time series. For example, you can forecast your April sales based on the average of quarterly sales. Simply use the formula: “=AVERAGE(Cell of first value range:Cell of last value range)”
Image 1. Moving Averages
Your April sales are based on the average of Jan, Feb, and Mar sales. The forecast for May is from the average of Feb, Mar, and April, and so on.
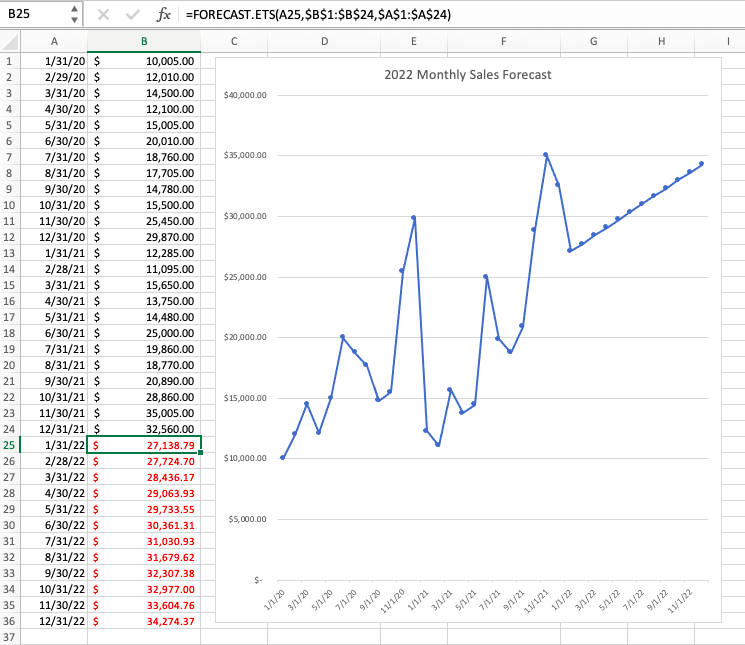
Exponential smoothing is useful for systematic trends and seasonal patterns. The goal here is to create a forecast based on the same seasonal patterns from the previous years.
Illustration. Listed in the table are 2020 and 2021 monthly sales. Using these historical data, calculate the monthly sales forecast for 2021. Follow these steps:
Image 2. Exponential Smoothing
Given the same seasonal patterns in 2022, you can forecast sales by month. Once you know your forecast, set your target sales and work back the amount of inventory needed to meet your sales goals.
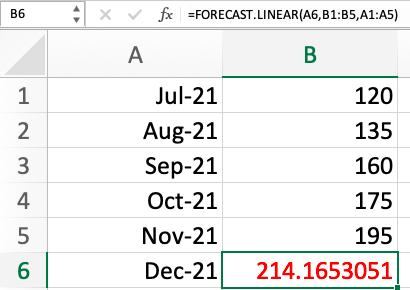
The FORECAST/FORECAST.LINEAR function predicts future values for linear regression. It doesn’t consider the moving average unlike ETS.
Suppose that you want to forecast the inventory level of Product X for the entire month of December 2021. Here’s how to use linear regression to forecast inventory:
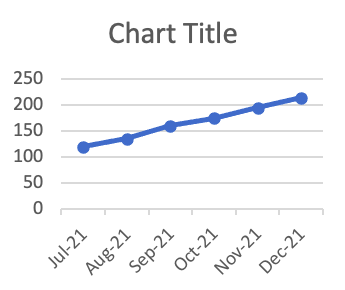
Column A represents the sales period from July to December 2021. Column B, on the other hand, shows the sold quantity for Product X in those months. Given the actual demand from previous months, calculate the forecasted inventory level for this product for the entire month of December.
Image 3. Linear Regression
Image 4. Linear Regression
This forecast shows that following a linear trend, you will need 215 units of Product X to meet December 2021 demand. Drag the formula to forecast the subsequent months by using the absolute value “$”.
Inventory forecasting in Excel is a good tool for business startups, but it does not hold up over time.
Keeping track of transactions and inventory becomes increasingly difficult as your business grows. And once you reach year two, you’ll find Excel counterproductive. It’s time-consuming, prone to errors, and has limited accuracy and capability.
The only way to move forward is to adopt recent innovations, such as Inventoro. One of our core functions is automated forecasting backed up by over hundreds of algorithms and deep learning technology.
In terms of accuracy, you don’t have to worry about limitations. It includes all types of internal and external variables that can affect the movement of your stock and helps you identify bottlenecks or losses caused by poor inventory control—so you do not have to worry about shortchanging your top-sellers or overstocking your less profitable products.
Learn more about our powerful forecasting tool or experience the benefits first-hand by requesting a demo.
Become a retail mastermind you always wanted to be.