Sales forecasting
and inventory optimization
Become a retail mastermind you always wanted to be.
Become a retail mastermind you always wanted to be.
Written by: Jul Domingo
“Managing a small business is difficult. You are in charge of everything, from sales to marketing to recruiting, firing, leasing, and inventory.”
– Jeff Ber, Entrepreneur and Business Management Expert
Inventory forecasts are essential, especially when consumer preferences and supply chains fluctuate so much.
For SMB owners, this unpredictability can cause a few headaches. Some are inconsequential, while others can make or break a season.
To achieve accurate inventory forecasting, you need to glean insights from data analysis, industry trends, market expertise—and perhaps a touch of magic.
Learn what inventory forecasting is, how it works, examples, formulas, some handy tips, and a remarkable way to simplify the process.
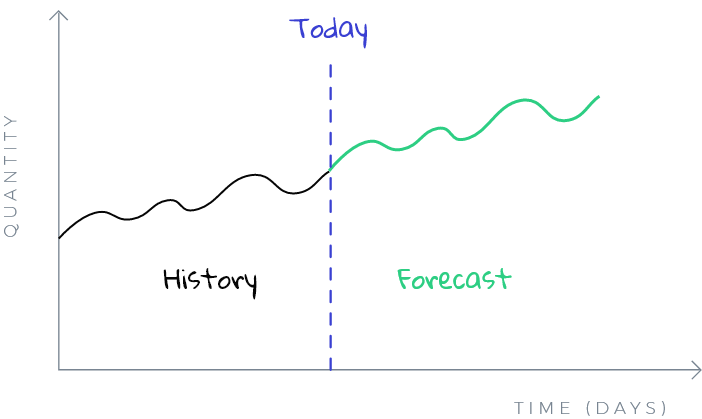
Inventory forecasting determines the amount of inventory needed to satisfy future customer demand based on the sales forecast over a certain period. It’s a practical solution to manage your purchases better, increase your revenue, and reduce unnecessary costs.
With accurate inventory forecasting, you can keep enough inventory on hand without draining your cash reserves.
The most successful businesses can reduce risks, meet future demands, and avoid future losses—and inventory forecasting is one way to achieve this. However, forecasts don’t have a one-size-fits-all formula.
“Inventory forecasting is challenging because it requires a business to analyze large amounts of data for products that are constantly changing in price and availability.”
– Stephen Curry, CocoSign CEO
Let’s take a look at the main forecasting techniques, which fall into four main categories:
This demand forecasting method uses trend patterns to predict future demand in inventory. It relies on sales history, present purchasing habits of your customers to scale the potential of your products, their needs, and possible cultural shifts.
Leonardo Gomez, founder of RunBall, a dog toy brand, believes trend forecasting is useful for making a lot of futuristic decisions.
Predicting how many stocks to sell will also enable you to estimate how much inventory you will need. Therefore, it depends on the upward and downward slopes of your forecast. Your trend forecast results can also inspire further research to improve inventory strategies.
A small business selling accessories has been running for eight years. Over the years, the business has been profitable. However, there are no plans to expand yet.
Their historical data over the last three years shows that November, December, and January are their top-performing months, while May and June are the least successful.
Using this data, they can develop a trend projection that indicates when they should place their orders for supplies and products. This information can also enable them to set up a marketing campaign during their slowest months next year that would boost sales.
This inventory forecasting method uses a graphical representation to interpret past data. It can be a histogram, a line graph, or a pie chart.
Suppose you analyze data points between customer demand and the supply chain in a forecast period. Using numerical data alone is bland and confusing. The visuals will be more accessible and efficient for the decision-making body.
By creating a graphical forecast, you can get a similar image of data between those periods. It will give you a clearer picture of the data trend as a whole. Developing inventory management procedures will be easier and more comprehensive that way.
Qualitative forecasting focuses on external influences such as political, economic, and environmental factors. This method is a subjective approach that requires the judgment of an expert. According to
Daniela Sawyer, a business development consultant shares, “Qualitative forecasting is based on non-measurable information. It’s especially critical when a company is just getting started because there isn’t much data.”
Here, we’re talking about current and real-life situations that can affect business operations. Besides expert judgment and market research, another qualitative technique is the Delphi method. Its goal is to come up with a uniform forecast based on the collaborative opinion of various experts. They will answer questionnaires anonymously for several rounds.
A sustainable fashion brand wants to increase revenue by expanding their customer base. To conduct market research, they sent surveys to their existing customers. By analyzing the data, they developed customer profiles and discovered that most of their shoppers are millennials and Gen Z.
The company then decided to leverage social media channels, such as TikTok and Instagram, and ads to broaden their reach, including TikTok and Instagram. Finally, using econometric principles, they evaluated the potential impact of a new marketing campaign on future sales—which they can use as the basis for predicting demand forecasts.
One method alone cannot give a comprehensive forecast. When you use the qualitative approach alone, the results are not factual enough. Likewise, you cannot solely rely on figures and statistics from quantitative forecasting.
In quantitative forecasting, the basis is historical sales data. The operation from the previous year will be the foundation to calculate the anticipated future sales. Seasonal trends like high fluctuations in Christmas sales also affect the quantitative forecast.
Time-series forecasting is a type of quantitative forecasting, which uses quantitative data to create a model that predicts future trends.
This inventory forecasting model applies to any timeframe, and it’s flexible enough to account for rare events that can affect the business. There are two types: moving average forecasting and exponential smoothing.
In moving average forecasting, you take the demand data from the previous period, calculate the average demand for that period, and use this average to forecast the demand for the future.
For example, if you were to analyze 12 months, the 13th month would be excluded. By next month, the 12th month would be eliminated.
In exponential smoothing, you take into account actual demand for the current period and the previous forecasts. You can tailor the results of your model to fit your company’s market positioning by adding a smoothing constant.
An example of this is during the COVID-19 pandemic, when a company finds it more helpful to incorporate more recent sales data because of its relevance.
In 2019, a case study proved that a combination of forecasting methods creates better results.
Combining inventory forecasting models can provide more comprehensive data to predict future sales and estimate the amount of inventory needed to meet demand without the risk of product loss or spoilage.
You can adapt to unexpected changes in consumer demand by using a mix of different methods.
“For our business, we tend to follow the trends for inventory forecasting along with the quantitative methods. This helps us keep a clear and defined track of the data.”
– Leonardo Gomez, RunBall Founder
Different inventory forecasting formulas help identify the optimum stock levels to maintain and the definite time to reorder. This way, you can avoid losses both in surplus and out-of-stock situations.
However, there’s a downside to using formulas: they require a lot of work to determine and manage. Fortunately, modern technology has made it possible for smart inventory forecasting software to provide more precise reorder points by providing integrated predictive analytics and reordering capabilities.
Regardless, it might be useful for business owners to become familiar with these concepts:
Lead time: The number of days between the date of the purchase order and the date of delivery.
To compute the lead time, observe the regular interval of waiting before receiving the supplier’s stocks. For example, if you order today and receive it later within 7 days, your lead time is 7 days.
Lead demand: The total anticipated sales during the lead time. It helps you keep the inventory level needed to avoid running out of stock. The formula to compute for the lead demand will be:
Example:
7 days x 25 units = 175 units
The 175 units represent the number of stocks you need to keep while waiting for the new stocks.
Safety stock: This is the extra quantity on hand to prevent out-of-stock situations. You can see them idle in the stockroom or warehouse in case of fluctuation in supply and demand.
Example:
Following the same case as your average daily sales and lead time, let’s assume that the maximum daily sales are 30 units and the maximum lead time takes 10 days. The safety stock would be as follows:
(30 days – 25 days) x (10 units – 7 units) = 15 units
Reorder point: This point refers to the specific stock levels for inventory replenishment. When the inventory reaches the said quantity, new purchase orders shall be made.
You can compute it either with safety stock or without safety stock. It all depends on the nature of your business and the buying habits of your customers.
Example:
(25 units x 7 days) + 15 = 190 units
The reorder point means that the moment your inventory level is reduced to 190 units, you need to restock immediately.
While the reorder point formula is a classic, it can lead to several problems. When multiple products reach reorder status at once, your system will become overloaded. Moreover, a business will have to devote more resources to restocking inventory because the replenishment items need to be ordered earlier.
Keeping your inventory stocked in a timely manner can prove difficult for SMBs. Investing in inventory forecasting and replenishment software is an easy way to resolve this issue.
The EOQ model aims to reduce expenses, particularly the costs to pay for logistics and warehouse spaces. The larger the quantity you order, the less frequently you need to order, and the more money you save.
However, the EOQ model’s biggest flaw—and this is a big one—is that it assumes constant demand for a business product and quick access to restocking, dismissing seasonal or economic fluctuations.
Here’s how to calculate the EOQ:
Example: If the annual sales estimated are 25,000 units, the cost to hold your inventory is $10/unit, and the logistic costs to process your order is $180, your EOQ forecast would be 948 units. This only means that your reorder point is 948 units.
You can create an inventory forecasting Excel worksheet by inputting a series of dates and values in a single worksheet. It’s the most straightforward hack to use your sales data to predict future operations. The following steps will enable Excel to show you the predictive value of your forecast.
However, Excel has plenty of downsides when it comes to demand forecasting. Read more about it here.
“After successful demand forecasting, it will be much easier to forecast everything else for your small business.”
– Dragan Sutevski, Small Business Consultant
A better forecast will lead to higher profits and lower costs. So take note of these demand forecasting tips to make it more accurate and effective.
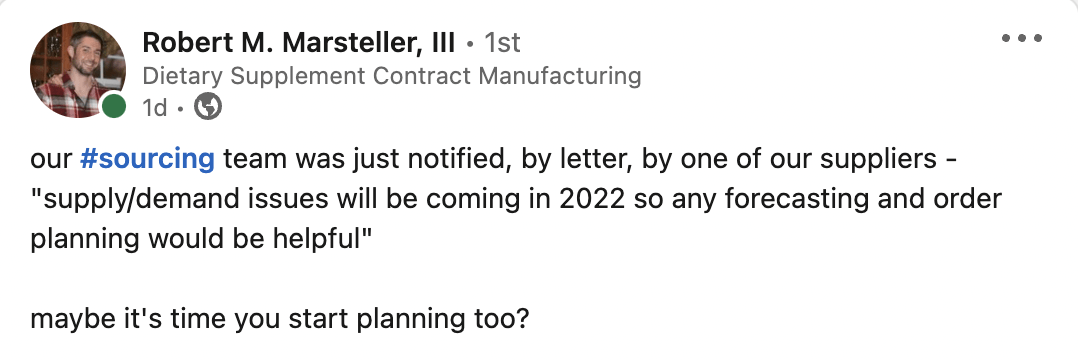
Source: LinkedIn
“Small eCommerce enterprises often start with spreadsheets since they are less expensive. However, inventory software management becomes necessary as an eCommerce business grows”
– Gerrid Smith, CEO & Founder of Property Tax Loan Pros
Remember when we said you might need a bit of magic to help project future demand? Automated forecasting can be your crystal ball, allowing you to see into the future.
Automatic inventory forecasting uses machine learning to enhance the prediction process continuously. “Instead of just tracking your inventory, you’ll be able to estimate appropriate stock levels based on business goals and processes,” Sawyer adds.
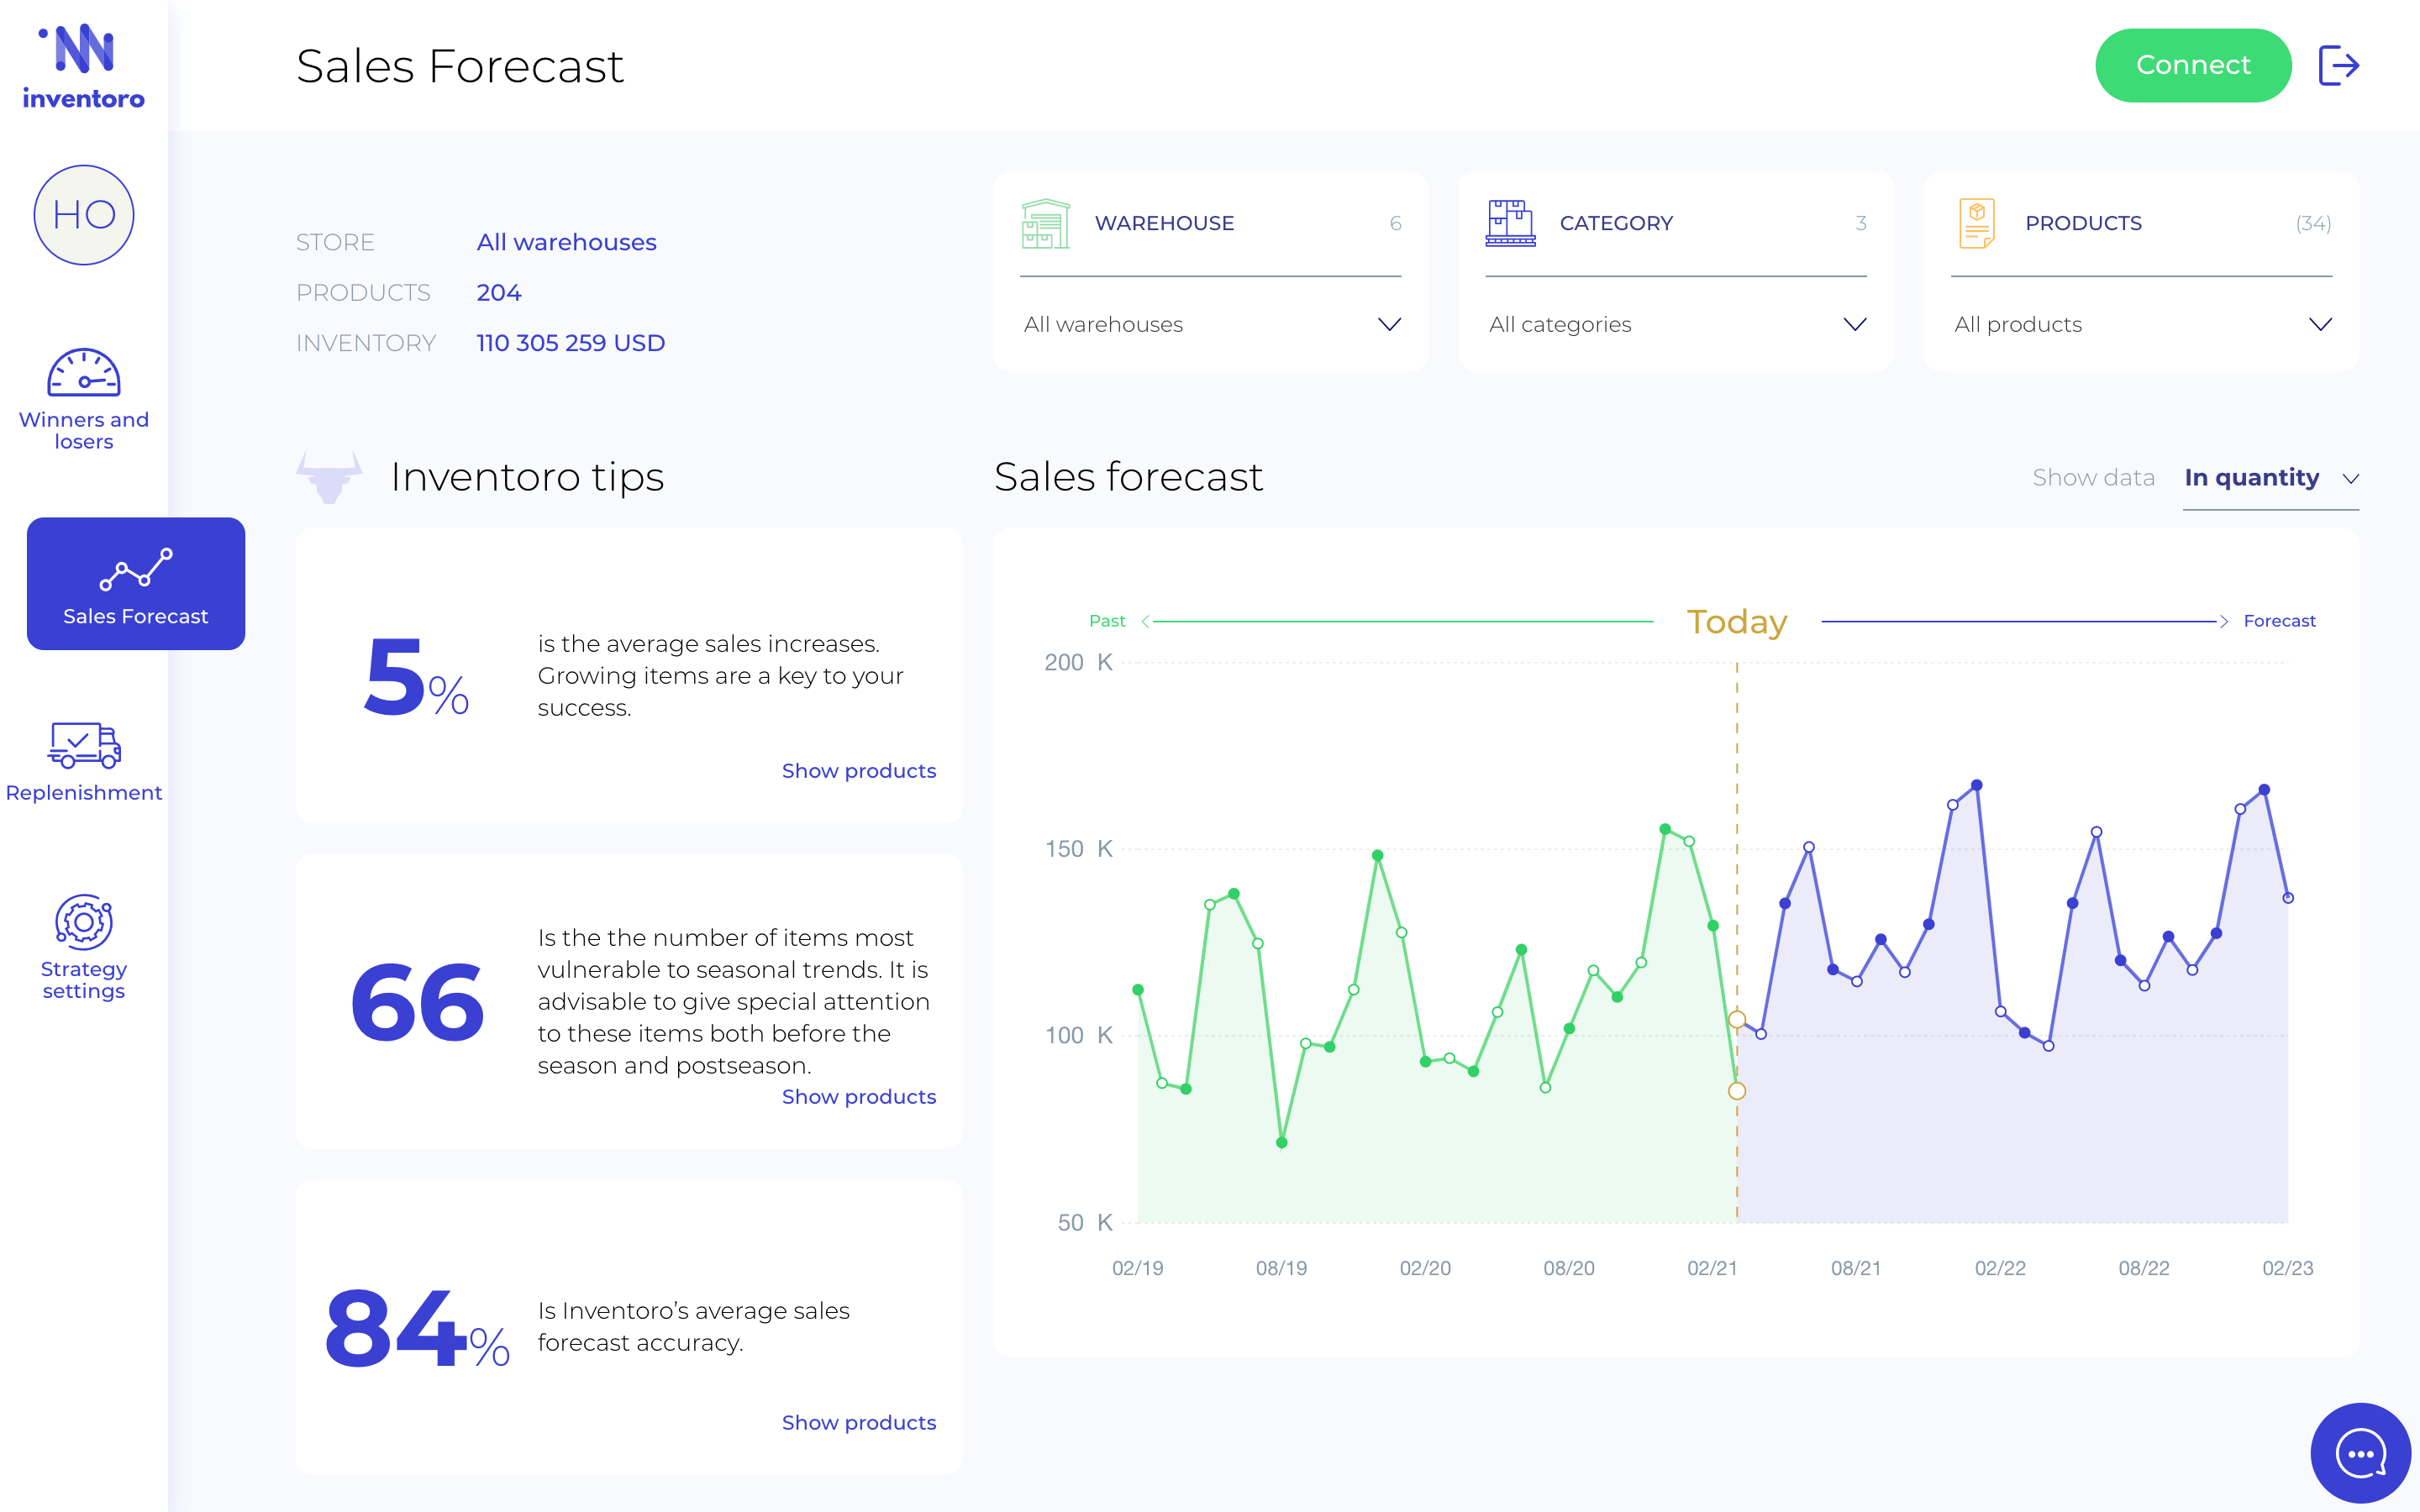
Using our cutting-edge machine learning technology, Inventoro helps reduce supply chain network failures and stockouts and increases customer satisfaction and profits. Here’s how:
Sales forecasting: As the methods and formulas above have shown, it’s important to paint a picture of how your sales will be in order to determine your future inventory levels. Inventoro has been developed to deliver forecasts on the same day they are created.
Product segmentation: There’s no need to guess which products are performing well or not. With Inventoro’s product segmentation feature, we separate the winners, chasers, and losers in your inventory so you can better allocate your resources.
Replenishment: Order placement is among the most tedious but necessary parts of managing inventory. But with Inventoro’s replenishment system, you’re able to fully automate this process, saving you valuable time you can devote to other aspects of your business.
Ready to get past the struggle of predicting inventory levels for your business? Request a demo today.
Become a retail mastermind you always wanted to be.