Sales forecasting
and inventory optimization
Become a retail mastermind you always wanted to be.
Become a retail mastermind you always wanted to be.
Sales forecasting in Excel is a hot topic if you judge by how often those three key words are found in Google searches. But there seems to be a misconception that an Excel sheet is the right place to do sales forecasting, and we understand why. After all, sales forecasting is a mathematical discipline, and Excel is pretty good for calculations. Put those two together and you should be fine, right? No. And there are good reasons why it is not a good idea. We have written a lot on sales forecasting and how it should be done, and we encourage everyone to dig deep into our blog and read all about it. Here, however, we will attempt to explain why using a table processor isn’t the right way to do demand planning.
The number one rule in sales forecasting is counter-intuitive to what you thought you knew about the world: “Do not use your head”. Yes, intelligence is a powerful tool when it comes to problem solving, but it stands in the way of demand planning. Like it or not, your head is full of assumptions. The moment when you open your sheet to start drafting a table forecast, you are immediately prone to include assumptions based on the past. “Hey look, our sales grew 12% last year in this month. So let’s add 12% to this year’s sales. That’s how much we’re likely to sell.” Unfortunately, that’s not the way sales numbers work. The only three things we know about forecasting sales is that sales can go up, go down, or stay the same. And that knowledge will not take you far.
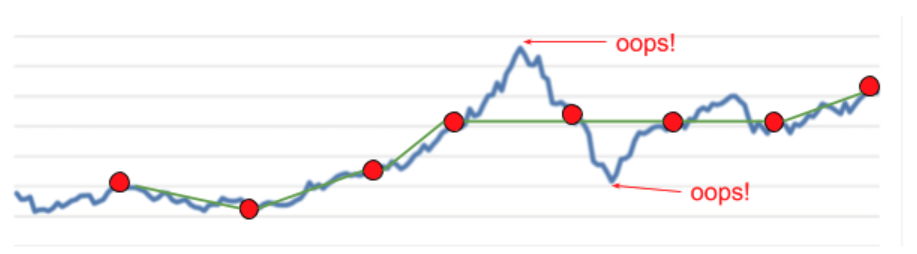
We might wish that sales curves followed a certain logical function. If we could just grasp that function and apply it to the future. But they don’t. Sales numbers look much more like the stock market. They’re a continuum, and when you put them in numbers (as opposed to linear graphs), you freeze them in time without knowing what happens in between.
The blue line above represents a sales graph, with the red dots showing your numbers in Excel when you measure sales over time. See where the problem is? Do you see why the green line is not a good representation of sales behavior over time?
Another key aspect of sales forecasting is taking into account missed sales opportunities, what we call stockouts. These are the moments when a customer comes to the store with the intention of purchasing goods but leaves empty-handed, because you didn’t have the goods in stock. Excel, unfortunately, is a very bad tool to identify stockouts. It gives you a way to measure past sales and go from there. But past sales are not a representation of future demand. They only show your ability (or inability) to sell products, which is definitely not the same as measuring future demand.
Yes, there is a forecasting function in Excel, and there’s one in Google spreadsheets as well. It’s almost like a magic button, right? You enter your past sales, click “forecast”, and you’re all set, with something like this the result:
| Month | Sales |
|---|---|
| 1 | $15.53 |
| 2 | $19.99 |
| 3 | $20.43 |
| 4 | $21.18 |
| 5 | $25.93 |
| 6 | $30.00 |
| 7 | $30.00 |
| 8 | $34.01 |
| 9 | $36.47 |
| Month | Result formula |
| 10 | 38.76388889 =FORECAST(A14,$B$2:$B$10,$A$2:$A$10) |
| 11 | 41.32688889 =FORECAST(A15,$B$2:$B$10,$A$2:$A$10) |
| 12 | 43.88988889 =FORECAST(A16,$B$2:$B$10,$A$2:$A$10) |
No, no, no. Excel and Google spreadsheets use something called “linear regression” for forecasting. It’s a great tool to use for anything that shows linear behavior, like Covid cases for example. But not sales. There is no straightforward logic to sales, and no simple shortcuts will solve this issue.
Become a retail mastermind you always wanted to be.
The other thing about demand planning is that you want to get results for each SKU (item sold) independently. When you put the sum of your total sales in an Excel sheet and try to make assumptions from it, you will end up with a (wrong) number that doesn’t really tell you anything. While it might be nice to know how much total sales will be, that number is completely useless for any business decision making. What you need is a sales forecast for each item separately. Only then are you able to actually make any use of your results. But think about it: You input the last ten sales results of each of your items and come up with a forecast result in your e-shop with 800 items. That’s 8000 data entries to your Excel sheet. Good luck with that. Which brings us to the last point.
Let’s put our egos aside and assume (for the sake of argument) that you understand that sales forecasting is a science. After all, popular and effective sales forecasting formulas are in the public domain, free for anyone to use. So let’s say you dig into script writing in Excel, and you mimic the complicated formulas into insanely complicated Excel scripts. Even if you succeed, this process will take you too much time for it to have any value. Sales forecasting needs to be done every day, and you can’t invest a day’s work into a day’s result. That simply doesn’t make any sense.
We haven’t had much positive to say about Excel in this text, so now might be a good time to be crystal clear: This only applies to sales forecasting. Excel and Google spreadsheets are great products. We use them all the time, and we are grateful to the development teams at Microsoft and Google for their hard work in development. These are great products, some of the best products Microsoft and Google have. Use them where they work, but not for sales forecasting. Peace y’all.
Become a retail mastermind you always wanted to be.