Sales forecasting
and inventory optimization
Become a retail mastermind you always wanted to be.
Become a retail mastermind you always wanted to be.
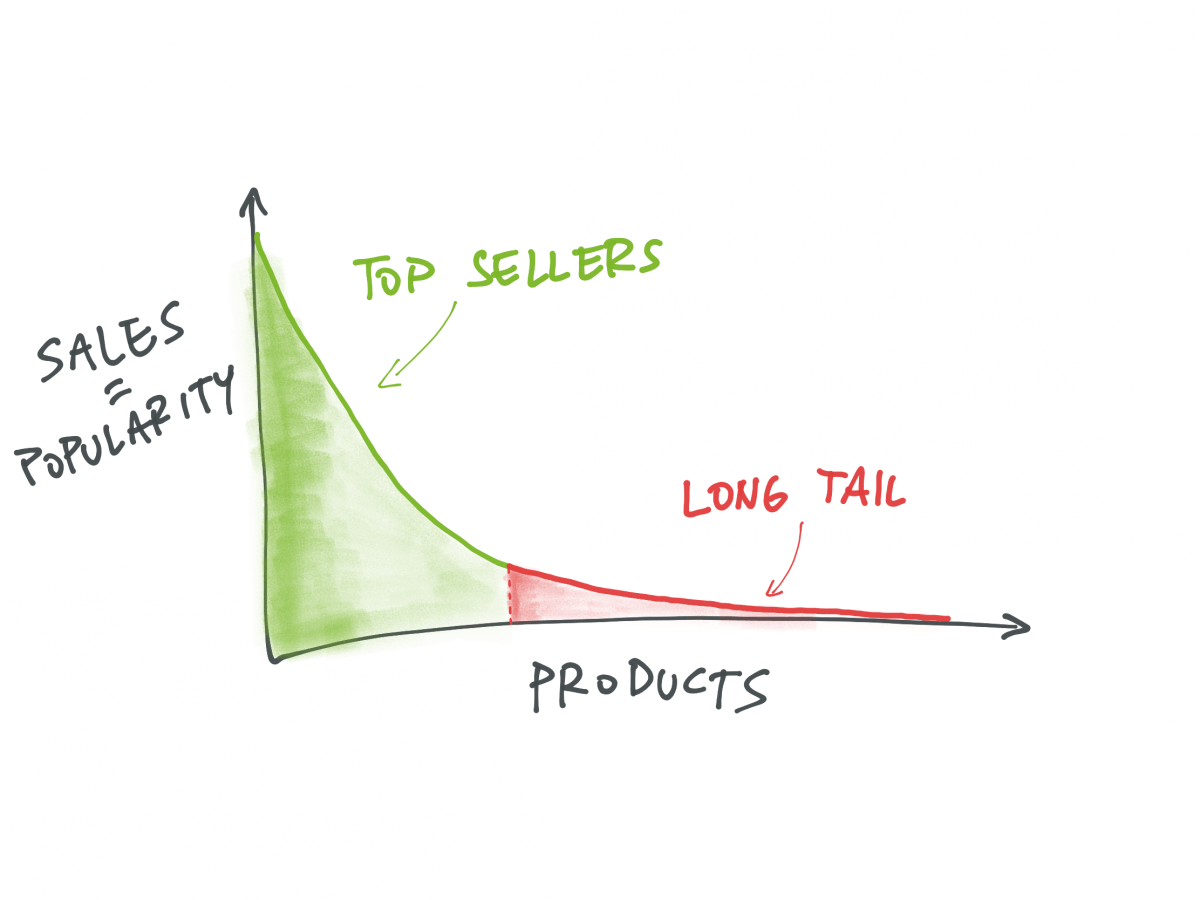
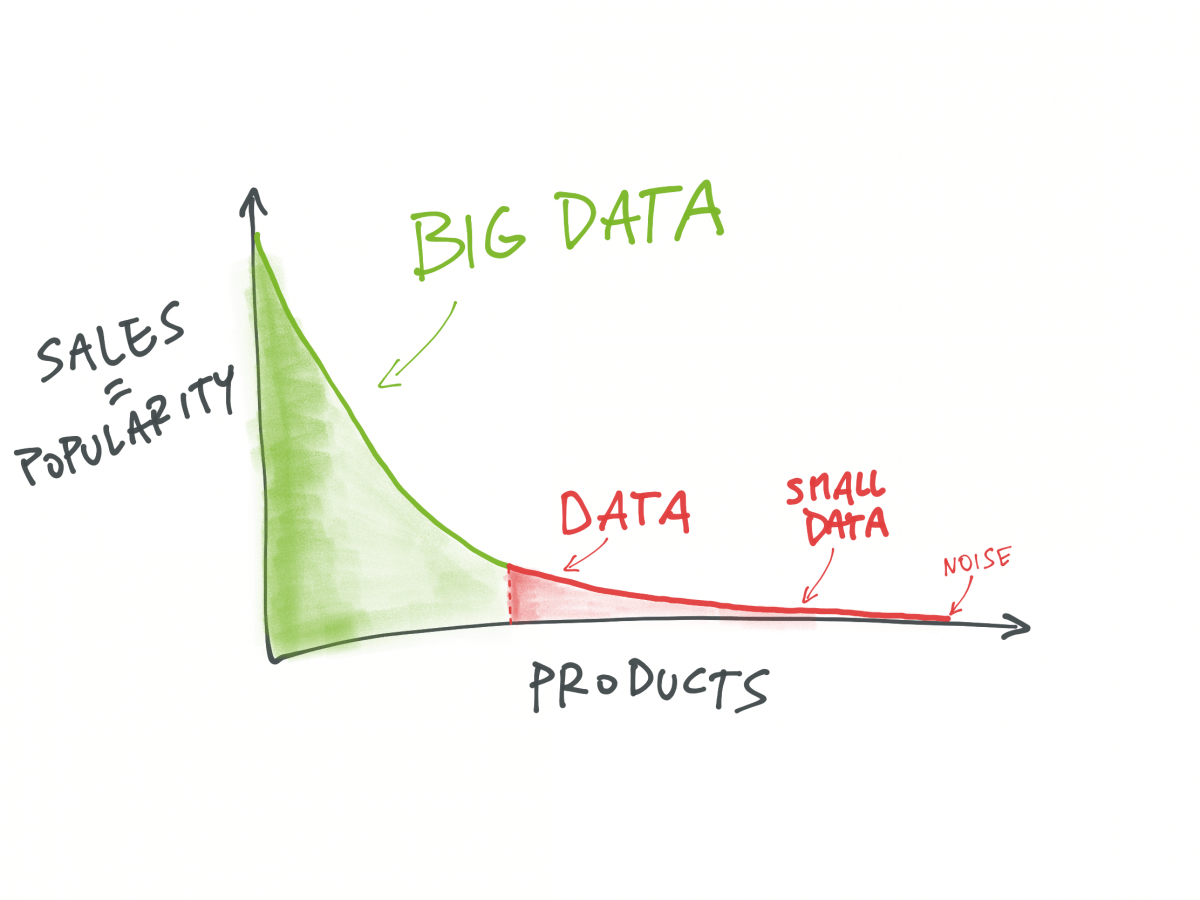
Imagine you want to predict the future sales for your top 10 sellers. As a main input, you have all the data from your ERP/e-commerce system, so calling this ‘big data’ is no overstatement. There are thousands (sometimes more) of sales transactions, with prices, customer data, even the time of day the sale took place. When you see this kind of graph with historical sales, you can predict the future with high accuracy. But what if we give you 10 products from the ‘long tail’ part of your portfolio? The deeper we go, the more unpredictability we can expect. In these deep waters even the best AI in the world fails, because there is not enough data for any real modeling and learning.
What is a long tail? You can see what one looks like in the graph below. When you put your products in order, starting with the ones with the highest historical sales or popularity of sales (sales frequency), you get this type of graph. On the left you see your best products, on the right your losers.
The problem with sales forecasting of intermittent or sporadic sales is that there’s not enough information or data for accurate forecasting. In the worst case, there are lots of zero sales days. They can be seen as data, too, but these days don’t contain any information about your customers or their behavior.
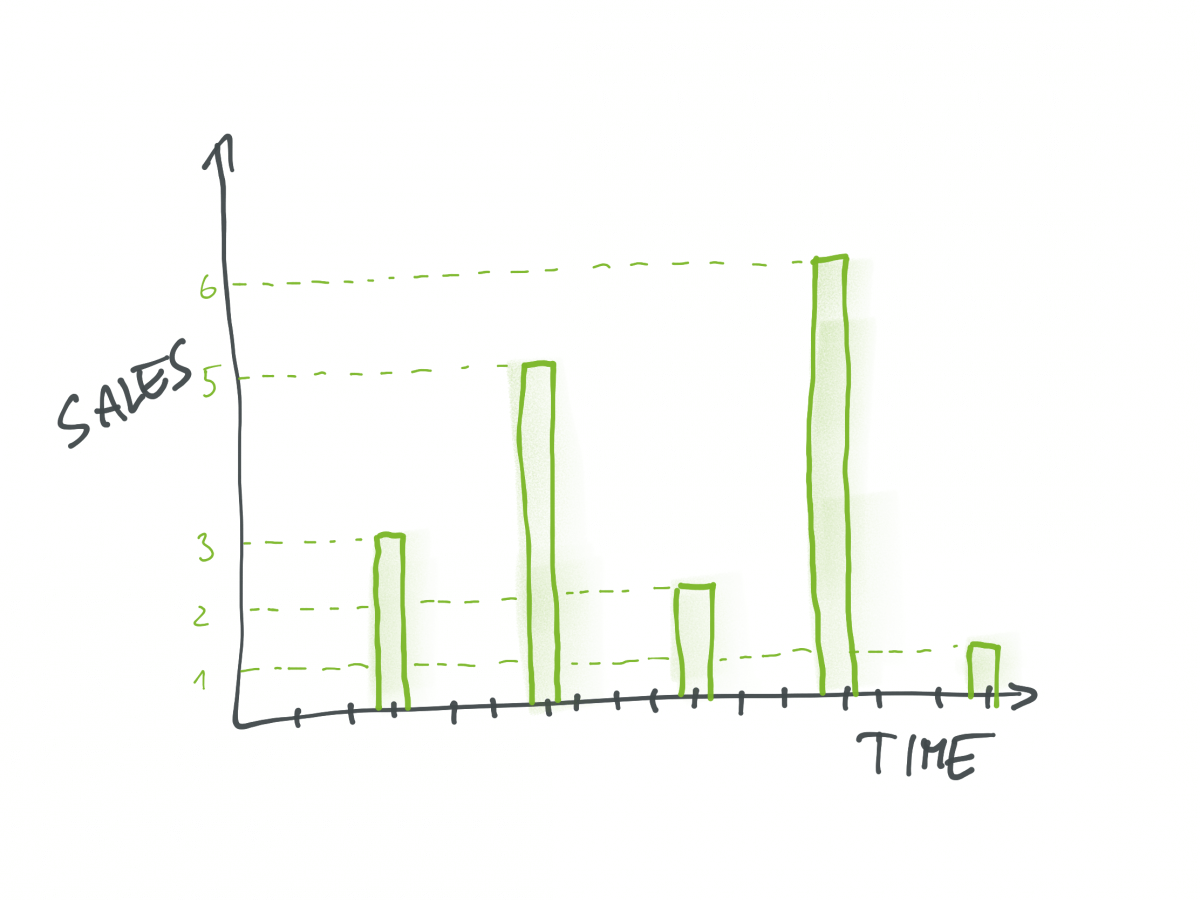
If you prepare a historical sales bar graph from a long tail, you get something like the graph below, something that resembles sheet music for a big drum, when the drummer beats on his drum only occasionally. There are lots of days or even months with zero sales, then some sporadic sales with just one or three pieces sold, then another three months without any sales. You know this situation. You’re never sure when you might sell the next product of this type.
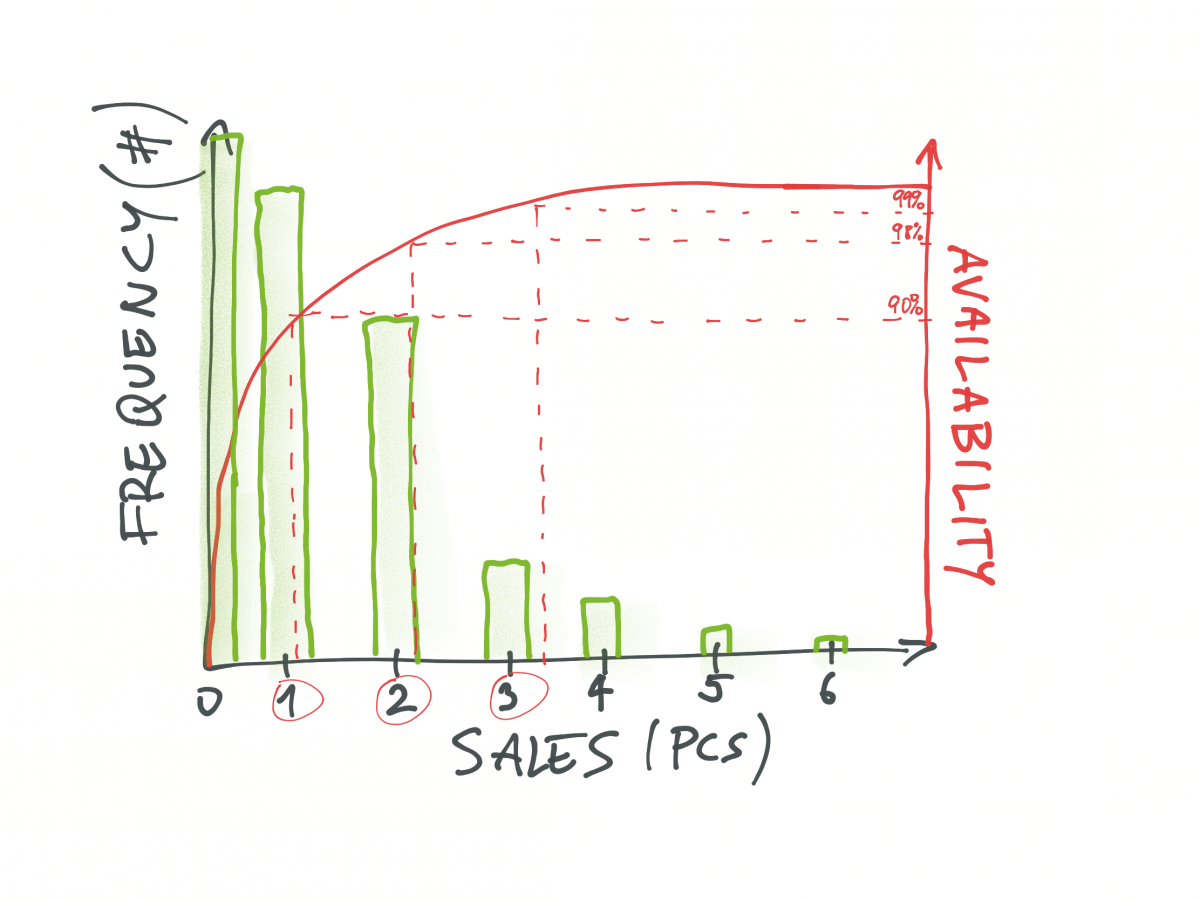
For sporadic products, we use a customized version of Smart’s probabilistic method. The daily sales for last year or the last several years are used as input data. From this data series, we choose X random days, X being equal to the days of the product’s lead time. For example, if the supplier’s lead time is 30 days, we choose 30 days as the main sample period. The sum of sales during these days is labelled Y. This figure basically says “it’s possible that during X days of lead time, Y pieces of the product will be sold”. This process is repeated 100,000 times, with individual Y results stored as we go along. From the results, we create a histogram of frequencies of Y totals. Given a service level Z (let’s say 99.5%), we select the quantity for which it is true that this (or a smaller) quantity of products will be sold in 99.5% of cases.
If all those Xs, Ys, and Zs got too confusing, here is the main point: The goal of sales forecasting of intermittent demand isn’t to achieve the most accurate forecast, but rather to predict how much inventory needs to be held to make sure you can meet demand for future random sales.
Become a retail mastermind you always wanted to be.