Sales forecasting
and inventory optimization
Become a retail mastermind you always wanted to be.
Become a retail mastermind you always wanted to be.
If you sell just one product to your customers, it’s crystal clear that your inventory will be transparent, and you’ll always know everything about it. And if you want to compete with IT technology like Inventoro, you’ll probably win.
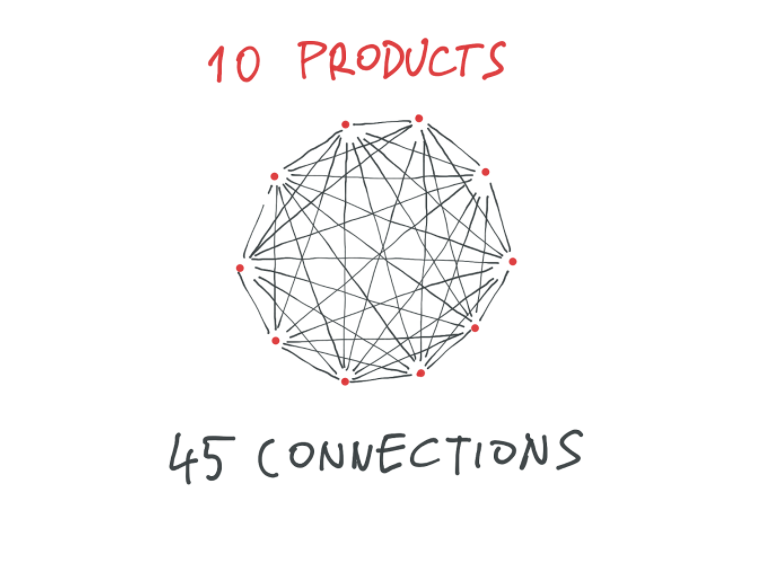
But If you sell 10 products, things get a little bit more complicated. On the one hand, you have to optimize stock levels for all 10 products. On the other hand, you have to consider that there are 45 unique connections among those 10 products. To be more specific, these connections cause your sales to be different than if you sold those 10 products in isolation. In this more complex case, there are all kinds of ways the 10 can affect each other: the substitution effect, the complementary effect, the cannibalization effect, to name a few. No matter what, in this case, probably the best you can do in your duel with IT technology is a draw, a tie.
Now imagine an ordinary retail or ecommerce company. They have hundreds, even thousands of products. Your average retail chain usually has several if not dozens of stores, all of them unique in their own ways. Some bigger, some smaller. Some sell more of this, some more of that. Let’s say that your average store has 1,000 SKUs. This means millions of hidden connections between your products. In this case, you have no hope of winning when you match wits with IT technology.
What does the optimal structure of inventory look like? What should you see when you look at your inventory?
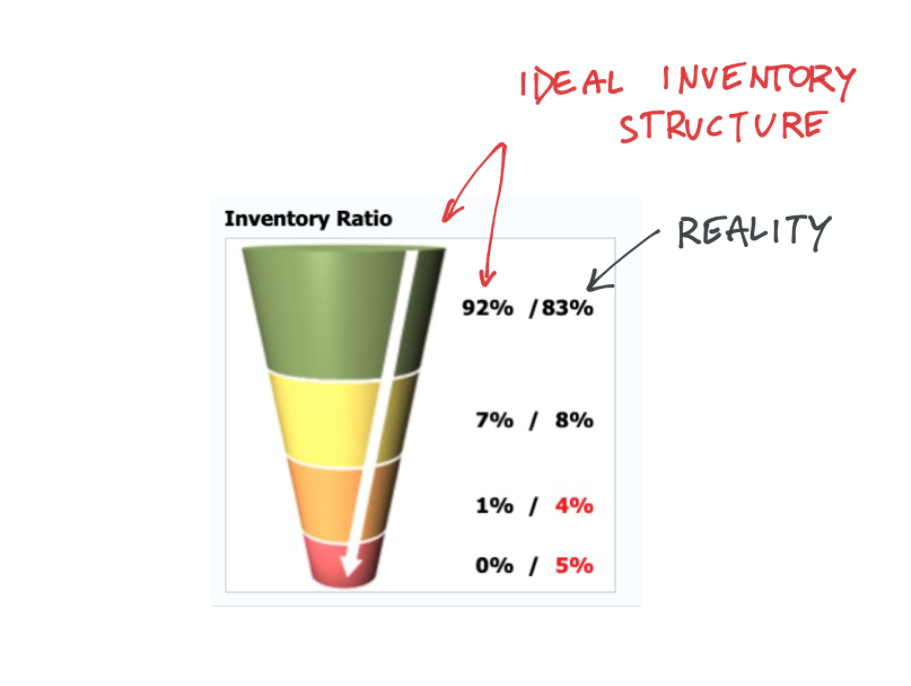
The funnel in the diagram below represents an ideal inventory structure, in terms of how much inventory you should hold in what areas, based on revenue and profit. The top part of the cone, the green part, represents your most profitable products. At the bottom in red you see your Loser products, the ones that rarely if ever bring any profit. Your optimal inventory levels should correspond to this structure. As you can see, this company has a nearly optimal inventory structure. Nearly, because the bottom two segments are a little higher than optimum. But it’s always like that, because in the long tail part of your portfolio you have to face high variability in sales. No company is ever completely free of dead stock.
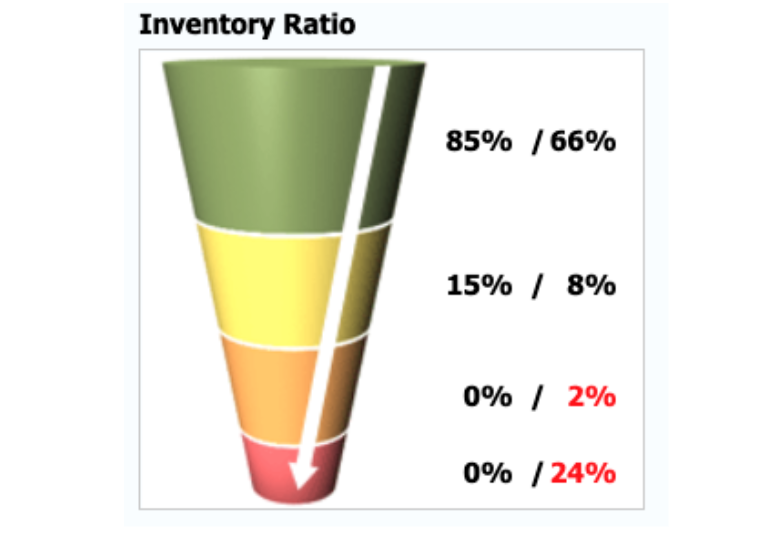
What we see quite often, unfortunately, is more like the graph below, which is the representation of an average retail company. The bottom part of the ‘cone’ is much bigger than it should be. That means this store’s inventory includes around 25% dead stock. Because this store is holding so much dead stock in its inventory, it doesn’t have enough space for its cash cows.And without enough space for its cash cows, stockouts come more often than they should.
Our experience is that e-shops and other companies from the ecommerce world hold up to 40% dead stock. That, unfortunately, is the sad reality of many of today’s e-shops: They hold Losers way too long, while at the same time running out of the goods that sell best, often because there’s not enough room in the warehouse. That’s why we created Inventoro. It confirms, in numbers, what you probably already knew. And then it helps you find ways to do something about it.
In complex situations like ecommerce, you as a shop owner will never beat the algorithms of IT technology. Try Inventoro now!
Become a retail mastermind you always wanted to be.