Sales forecasting
and inventory optimization
Become a retail mastermind you always wanted to be.
Become a retail mastermind you always wanted to be.
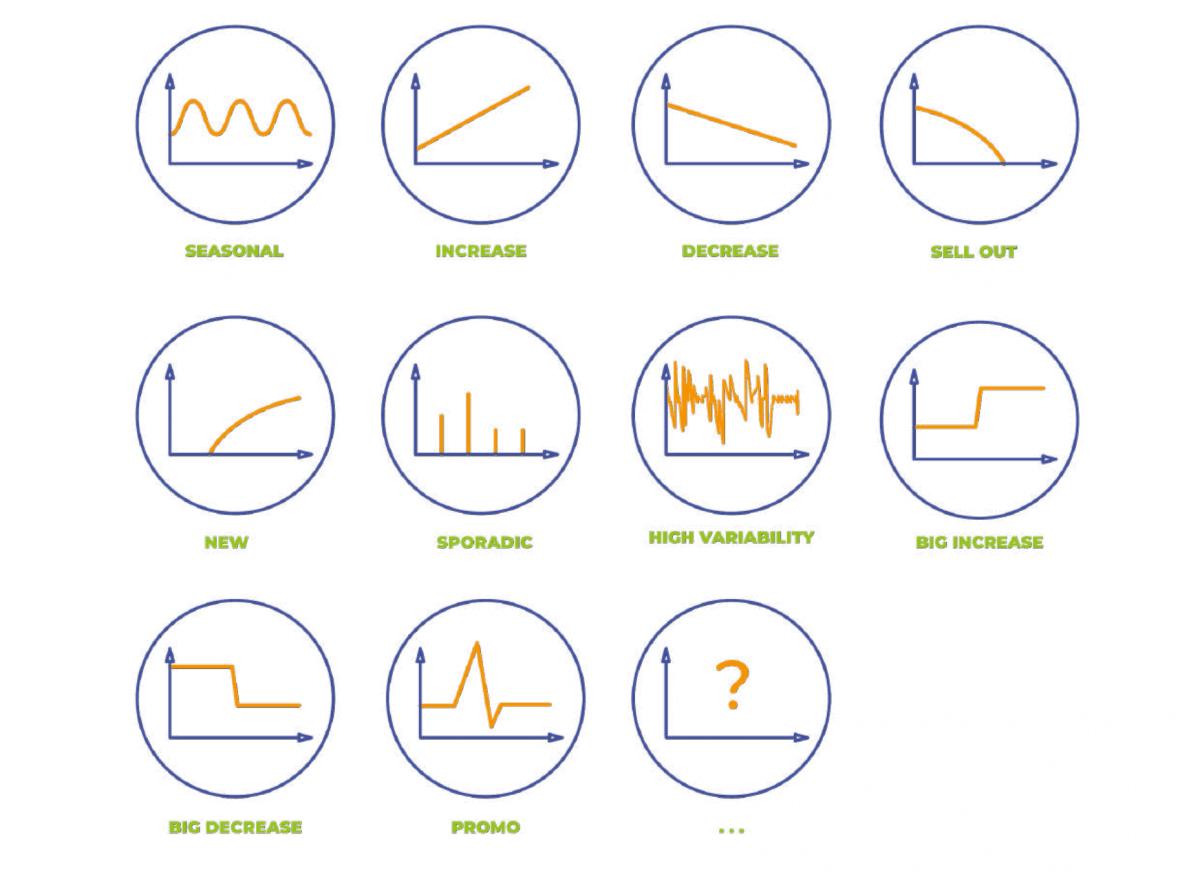
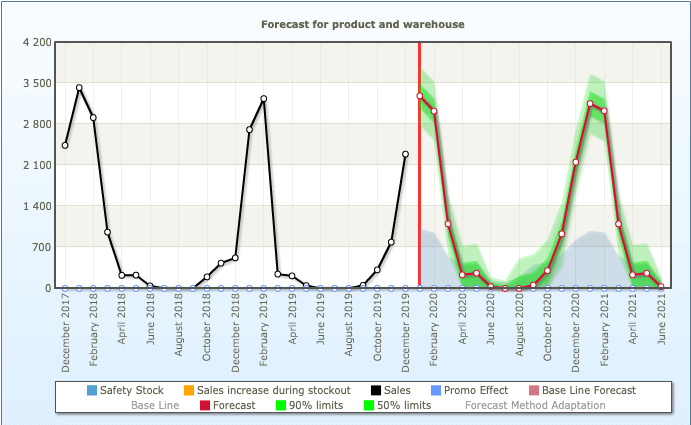
The ultimate goal of sales forecasting is to provide an engine that can automatically identify every big or small time-series pattern. In the picture below, you can see basic patterns: seasonality, increasing or decreasing sales, sellouts, new products, sporadic or intermittent demand, a substantial unexpected change in sales, promotion sales, etc. These are just standard in the real world.
You can use just a few forecasting techniques or as many different methods as possible (including machine learning) to provide a vast range. Still, at the end of the day, you always have to have a clear formula for picking the best method for every unique product in your portfolio, even for every product in every store. Every product is different. The same product but on different stores or sales channels has different behavior.
In this article, we will share automatic outputs from our predictive technology, which is behind Inventoro. None of these examples is manually adjusted. Everything is automatically generated by this sales forecasting engine within the Inventoro.
Become a retail mastermind you always wanted to be.
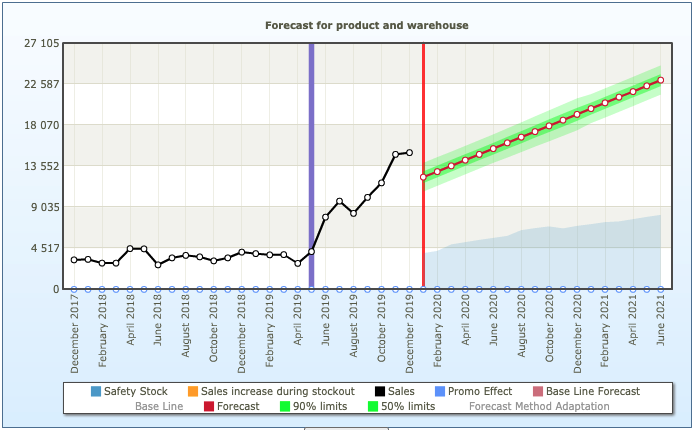
This example represents sales with an increasing trend.
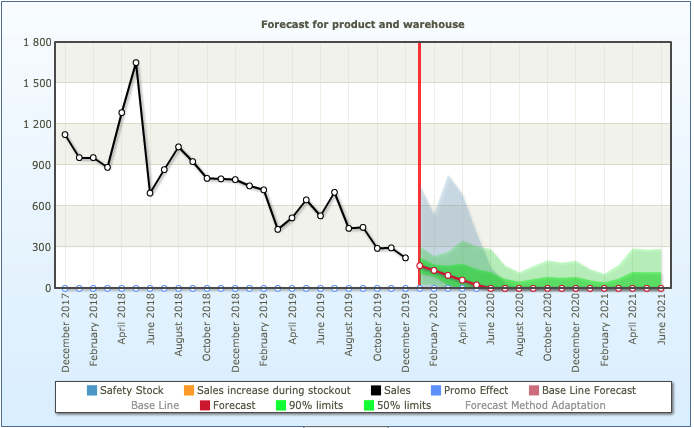
Once your sales are continually decreasing, future sales forecast should respect that.
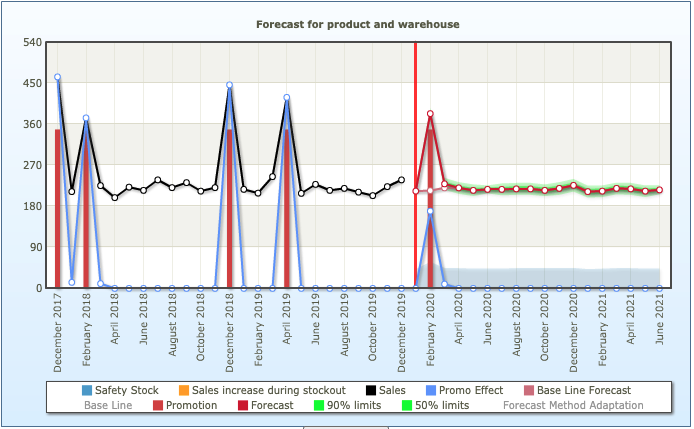
In case you are using discounts or any other type of promotions, you will be familiar with this kind of behavior. Once you offer the product with some exciting discount and this product has high price elasticity (means that with a higher discount, the sales will extremely increase), your sales will increase by tens or hundreds of percent. Firstly you should forecast so-called baseline sales (without any promotions) and then just promotion sales.
There are three types of seasonality:
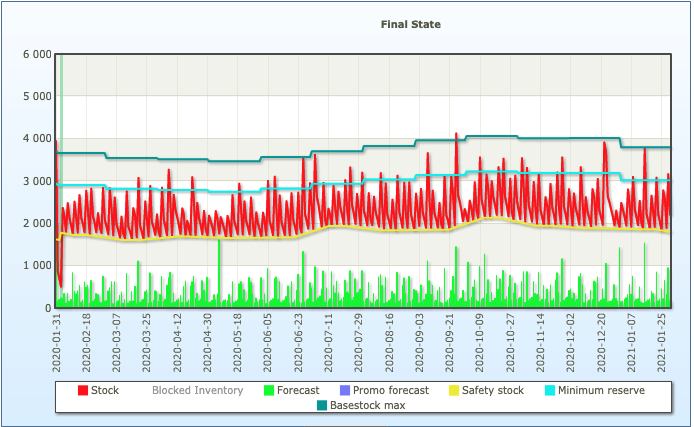
Sometimes you need lower granularity like days or weeks. There are two ways how to calculate daily forecast:
As you can see, daily forecasts (green color) are variable over the whole year.
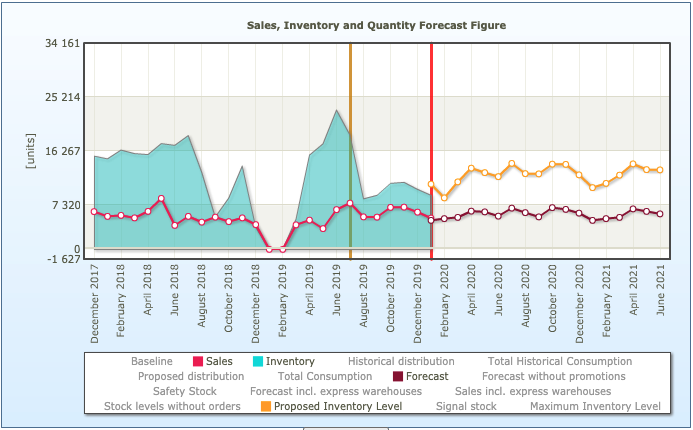
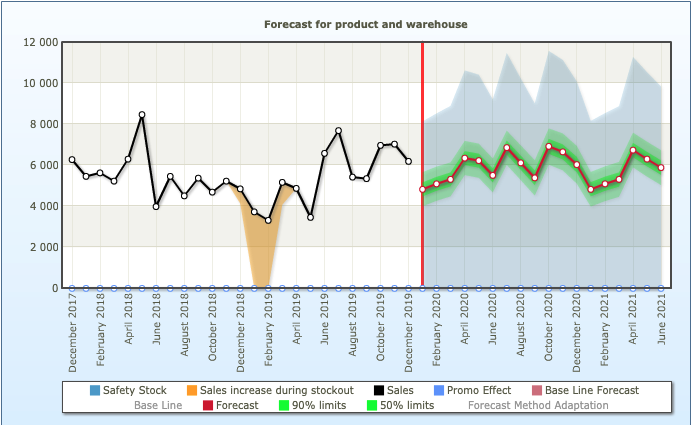
In the real world, you have to fight sometimes with stockouts. Stockouts are the moments in the actual sales where sales are almost zero because you don’t have any inventory for your customers. They need to stay unsatisfied, and sometimes they are trying to reach your competitor. In the first graph, you’ll see a historical stockout in January and February 2019. As you can see in the second graph, the future sales forecast does not include this stockout.
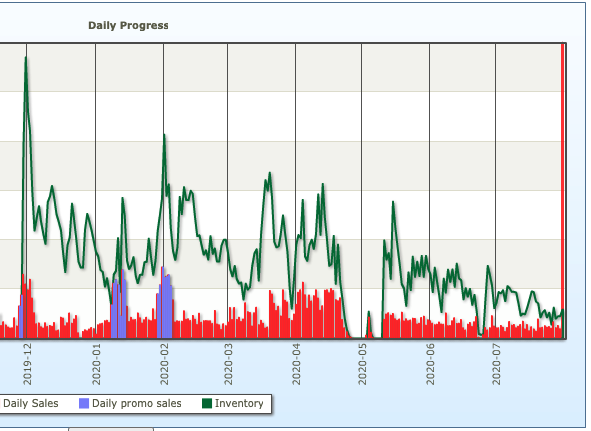
Another example of what is happening during the stockout, in this case, on daily basis, daily inventory (dark green curve) drops to zero and sales stop. This situation is your lost sales.
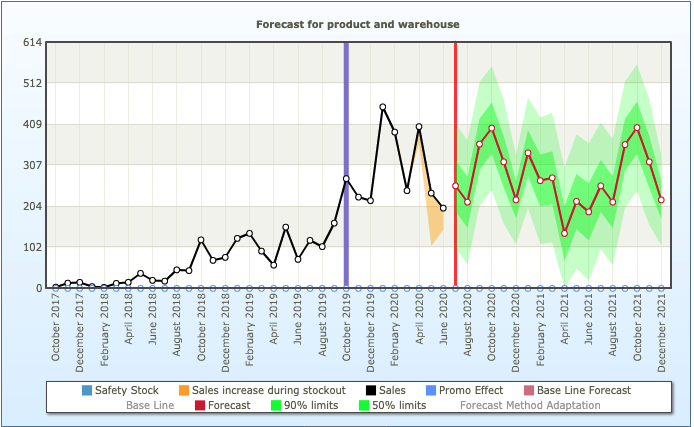
No one is prepared for the Covid19 situation. In some business areas, the sales dropped by hundreds of percent in other drops by tens of percent. Our engine is ready for these kinds of situations and automatically cut off the irrelevant history, as you can see below.
Other sources for sales forecasting:
Become a retail mastermind you always wanted to be.
