Sales forecasting
and inventory optimization
Become a retail mastermind you always wanted to be.
Become a retail mastermind you always wanted to be.
Key takeaways:
You know the situation when you ask your sales manager what your future sales will be. It doesn’t matter whether it’s next week, next month, or next quarter. These estimates will always be higher than reality. We know that very well, we’ve heard it a thousand times. Every time we hear it, we compare the sales forecast with the real sales numbers. And in almost every case, the sales manager has predicted higher numbers than the reality. These are what we call biased forecasts. For a wide variety of reasons, it’s human nature to overestimate sales performance, especially if you’re responsible for sales. It’s a repetitive, systematic error. The end result is that companies keep more inventory than necessary, which besides the obvious loss incurred also brings higher logistics costs.
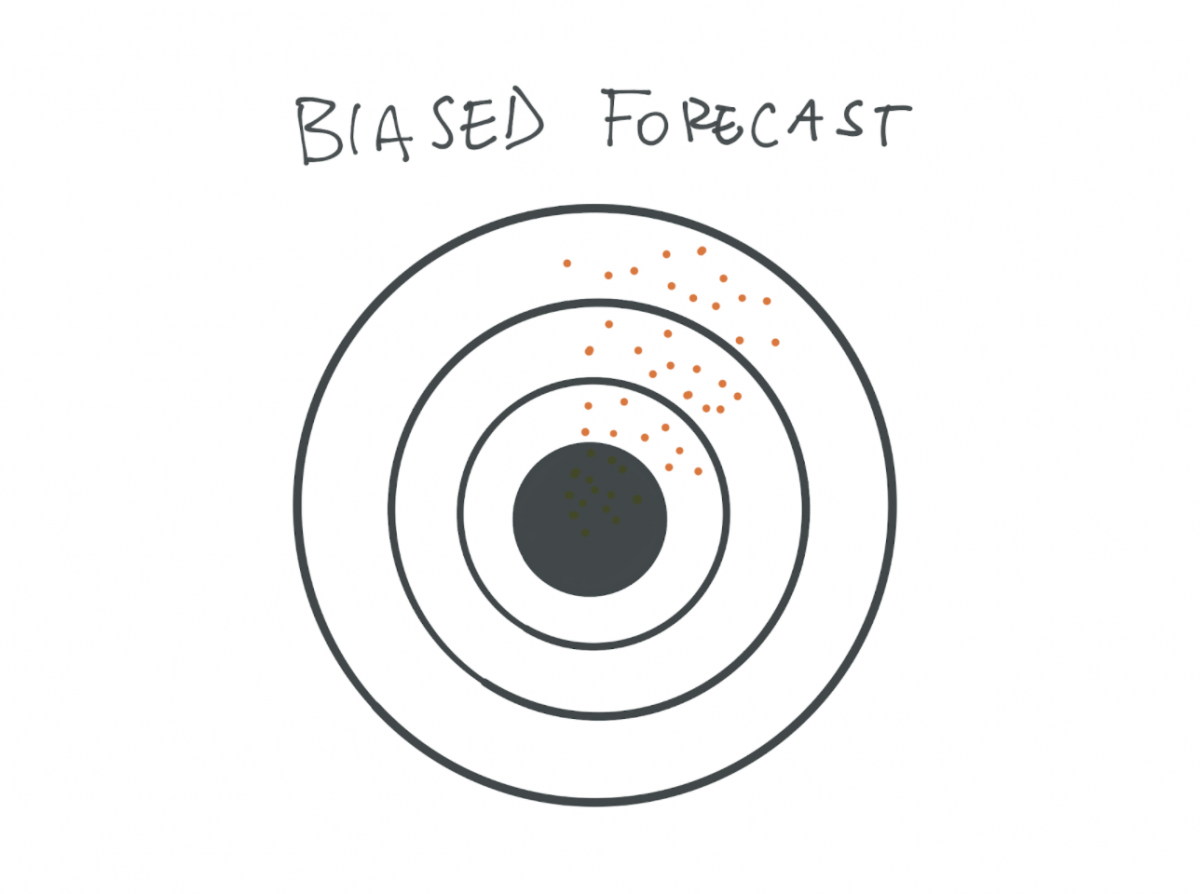
To help you understand what a biased forecast is we can use a dartboard, which is really the best way to understand forecast bias. When you play darts, you have several attempts to throw those darts to hit the bullseye consistently. It’s the same with forecasting future sales. In the analogy, the bullseye represents your company’s real sales, so hitting the bullseye means 100% sales forecast accuracy. Now, take a look at the diagram below. When you see a pattern like this, you can immediately recognize some systematic bias in your attempts. There is a systematic error that is causing your darts, your forecasts, to be off, either slightly or more. Every throw, every prediction, is somewhere above and to the right of the bullseye.
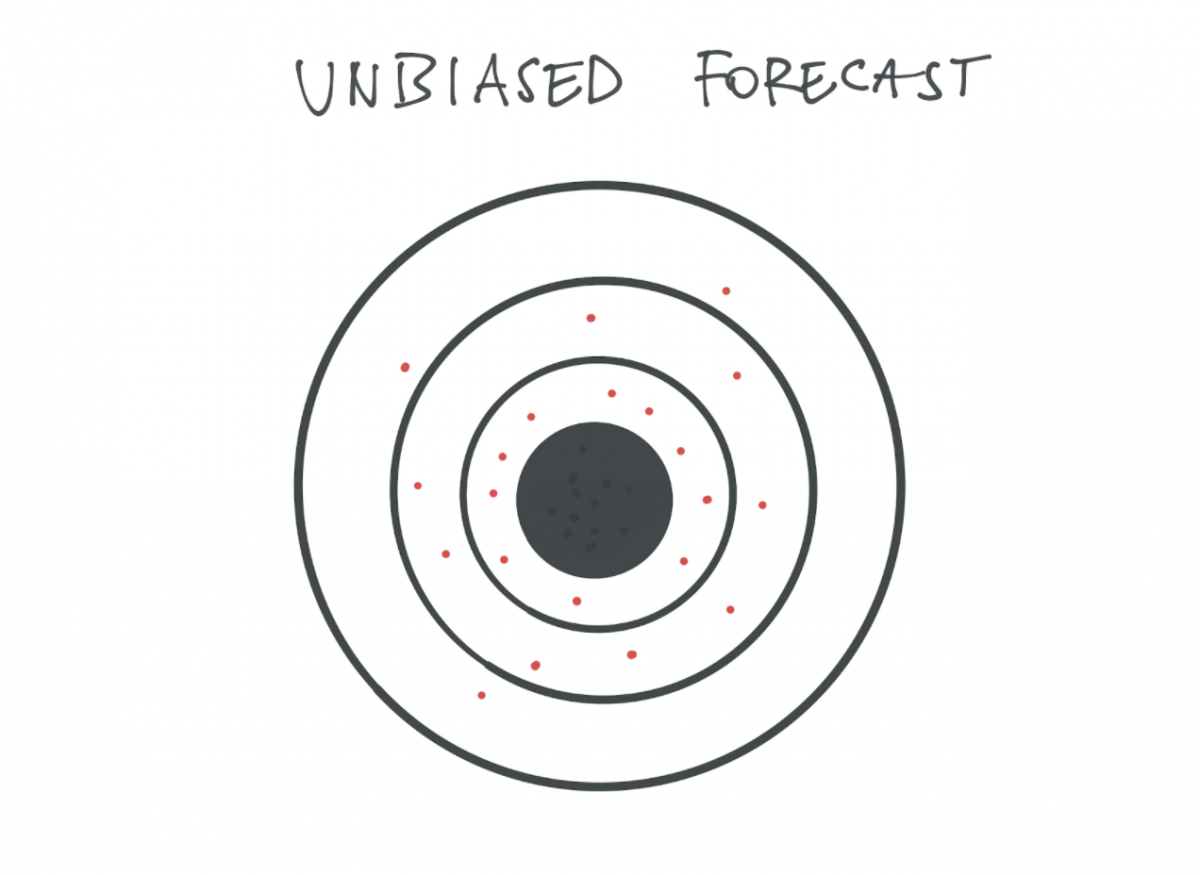
The main difference between biased forecasts and unbiased forecasts is that the ‘dart pattern’ of an unbiased forecast shows dart throws spread equally around the bullseye, as seen in the diagram below. When you think about it, if you have to be ‘off’ slightly, this is a more ideal bias scheme, because if you sum the differences of the individual attempts, you get an average which is pretty close to your sales reality.
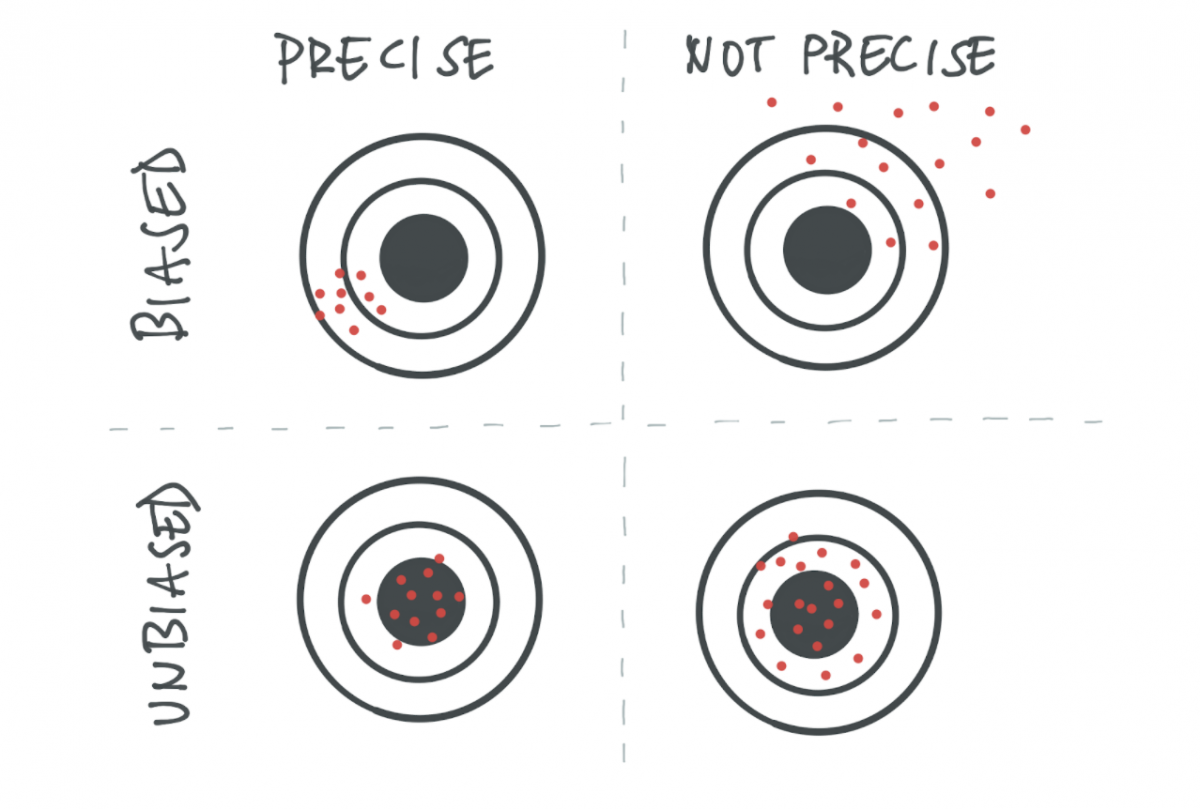
While it is helpful to have some knowledge of biased and unbiased forecasts, that’s not enough. It’s also important to understand the difference between precise and less precise forecasts. Precision of forecast measures how much spread you will have between the forecast and your real sales. When you combine bias and precision, you can make a matrix. Obviously, the best result is an unbiased, highly precise forecast. The worst case is a biased, less precise forecast.
If you are tired of missing sales targets and holding unsold inventory for months, even years, it’s time for you and your company to try sales forecasting that is custom-made to be as unbiased and precise as possible. Try Inventoro for 14 days for free, and you will see the difference between your sales forecasts and those created by 21st century technology with more than 103 different forecasting methods including machine learning and deep learning and the latest in advanced AI technology.
Sales forecast bias can be calculated using the following formula:
For example:
Your sales forecast is 100 pcs.
Actual/real sales is 120 pcs.
Forecast bias is calculated as 100/120 – 1 X 100 = 16.67%. That means that you underestimated your actual sales by 16.67%.
Your goal as a company sales director is to remove forecast bias from your forecasts. But that’s impossible for most people, for a variety of reasons. Humans, especially sales managers, have a tendency to inflate their predictions. The time for unbiased, highly precise forecasting is here. Try Inventoro now!
Become a retail mastermind you always wanted to be.


